Topic: Data Science
View as MarkdownI am a data scientist by profession and personality. I love trying to answer a question by finding the right data and pulling the answer out of it. I write about the tools I use to do data science, the methods, and even some of my results. You can find my articles on the subject below:
-
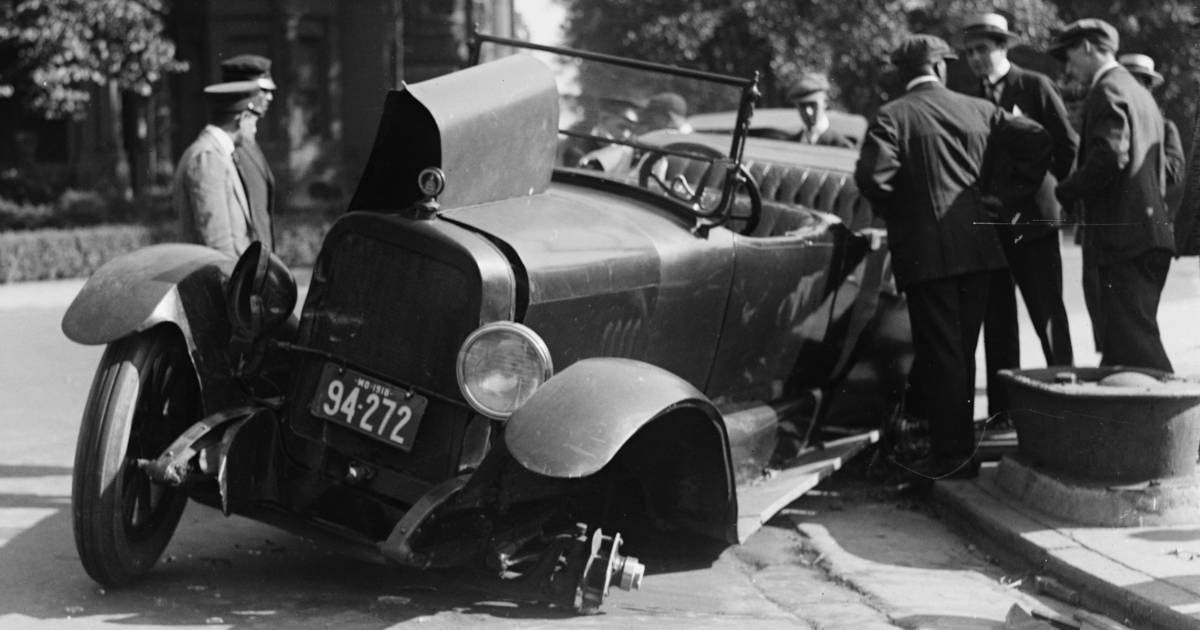 SWITRS: Pedestrian Safety on Halloween
Halloween can be a dangerous time for pedestrians. In this post, I explore the statistics on pedestrian-vehicle collisions, including when these incidents are most likely to occur. -
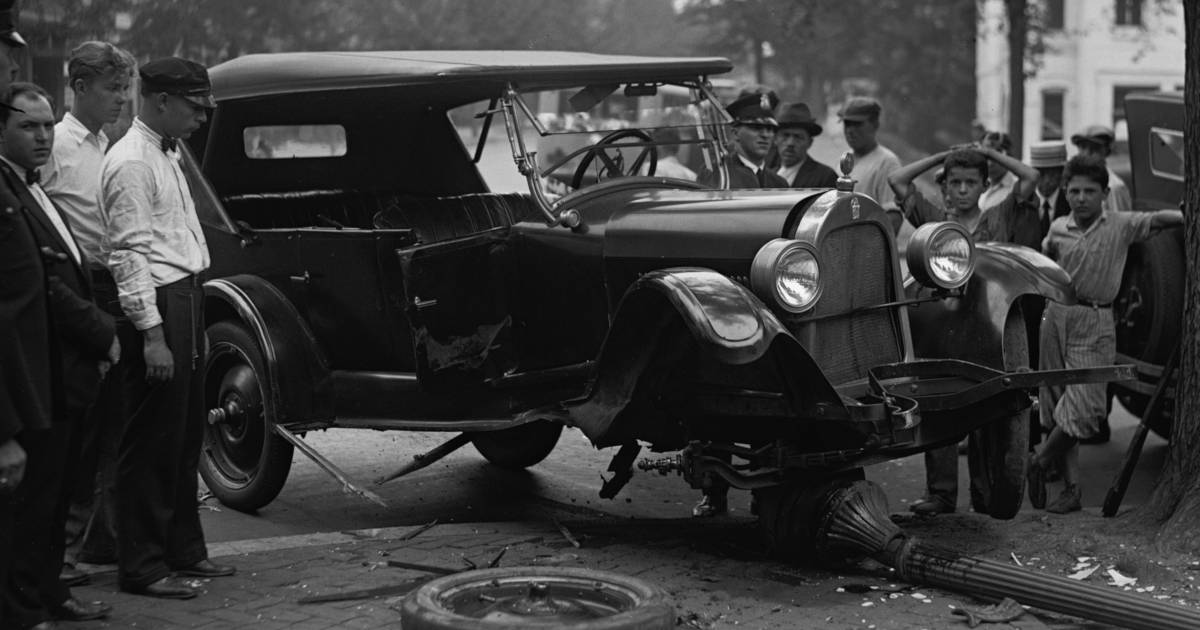 SWITRS: On What Days Do Drivers Hit Pedestrians?
Being a pedestrian is dangerous in a world built for automobiles. In this post explore how pedestrian-involved collisions have trended in time. Take a look! -
 Comparing Zillow, Redfin, and Realtor.com Price Estimates in Time
How do various online brokers' home price estimates change in time? I use a recently sold house near my neighborhood to find out. Come check it out! -
 Comparing Zillow and Redfin Price Estimates in Time
How do Zillow and Redfin's home price estimates change in time? I use a recently sold house in my neighborhood to find out. Come check it out! -
 Comparing Pre- and Post-sale Estimates of the Price of a House
Can Zillow and Redfin predict prices accurately? I look at a house sold in my neighborhood and compare the sale price to the price predicted by Zillow and Redfin before they knew it was for sale. -
 Data Science, Compensation, and Asking for Money
Advice about data science salaries and examples from my career of negotiating your offer. -
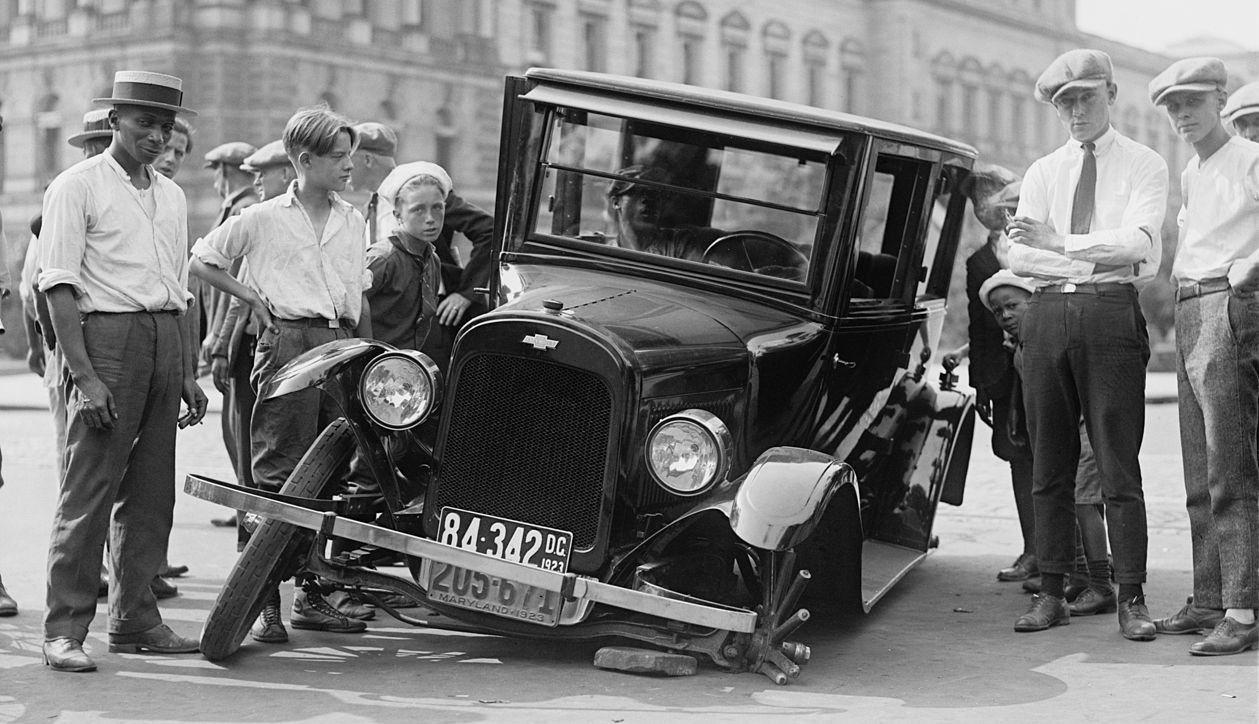
 SWITRS: Differences in Vehicle Collision Rates by Manufacturer During COVID-19
California was put under a stay-at-home order in March, 2020. Toyota drivers stayed home, Ford drivers did not; why?! -
 SWITRS: Increase In Traffic Fatalities After COVID-19 Lock Down
California was put under a stay-at-home order in March, 2020. As expected, traffic volume decreased, but what happened to rate of fatal accidents? They skyrocketed! -
 The Data Science Spectrum:
From Analyst to Machine Learning
Data science has left the era of the Unicorn and entered the era of the team, but that means there is now a whole spectrum of data science jobs. Here is what they do. -
 The Data Science Split:
From Unicorns to Teams
When data science started the job covered everything from setting up databases to running experiments to making models. But finding Unicorns was impossible; something had to give. -
 Where to Host Public Datasets?
When I released the SWITRS dataset, I had to find a place to host a 5 Gig dataset. Here is what I learned. -
 Jupyter Notebook Templates for Data Science: Plotting Time Series
Jumpstart your time series visualizations with this Jupyter plotting notebook! -
 Jupyter Notebook Templates for Data Science: Plotting
Jumpstart your visualizations with this Jupyter plotting notebook! -
 Jupyter Notebook Templates for Data Science
Jupyter notebooks are great for data exploration; jumpstart your work with this library of useful notebook templates! -
 The Gender Pay Gap in Data Science Salaries
How do the salaries of women data scientists compare to those of men? This month we explore pay by gender and location. -
 Data Science Salaries
How do data scientist salaries vary by experience and location? Read on to find out! -
 SWITRS: On What Days Do Cyclists Crash?
California crash data doesn't just cover cars, it covers bikes too! This time we look at when cyclists crash in California. -
 SWITRS: Car Crashes After Daylight Saving Time Ends
Daylight saving time leads to more traffic collisions, but what about when DST ends? Some researchers have found that it does lead to more crashes, so I take a look using California's SWITRS data. -
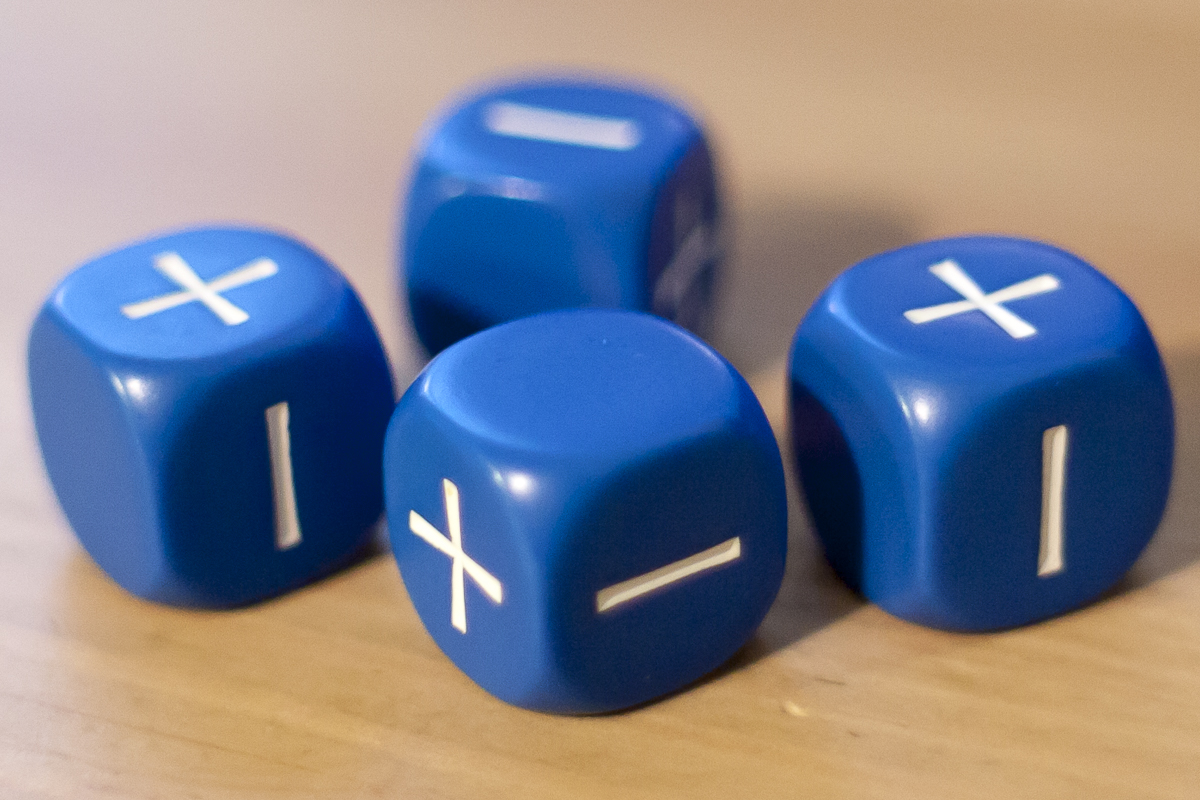 Fate Dice: Statistics Testing Is Hard
A few months ago I tested my Fate dice for biases. Now, I retest the "biased" set and see if it really is unlucky! Unfortunately, things aren't so clear... -
 Fate Dice Intervals
What does a "normal" distribution of rolls from a fair set of Fate dice look like? There are a lot of ways to estimate it. In this post I'll go through four methods. -
 Fate Dice Statistics
My friends and I played a Fate RPG for over two years. During that time we rolled a lot of dice and developed a lot of superstitions, but were any of them correct? -
 Visualizing Multiple Data Distributions
Need to compare a set of distributions of some variable? Histograms are OK, but try something fancier! Read on to learn about box, strip, swarm, and violin plots! -
 SWITRS: Car Crashes After Daylight Saving Time
Daylight saving time leaves us drowsy and cranky at work, but it also leads to an increase in traffic collisions! Find out exactly how many more there are with this analysis! -
 SWITRS: On What Days Do Motorcycles Crash?
Motorcycles riders are a different breed, born to chase excitement! So when do they crash? Using California's SWITRS data I find out! I'll give you a hint: it is not on the way to their 9-5! -
 Software Testing for Data Science
Much of data science involves writing code; for data cleaning, parsing, and modeling. Software tests can ensure that your code does what you think it does! -
 SWITRS: On What Days Do People Crash?
What day of the year has the most car crashes? The fewest? Find out as I look at California's crash data! Hint: they're both holidays! -
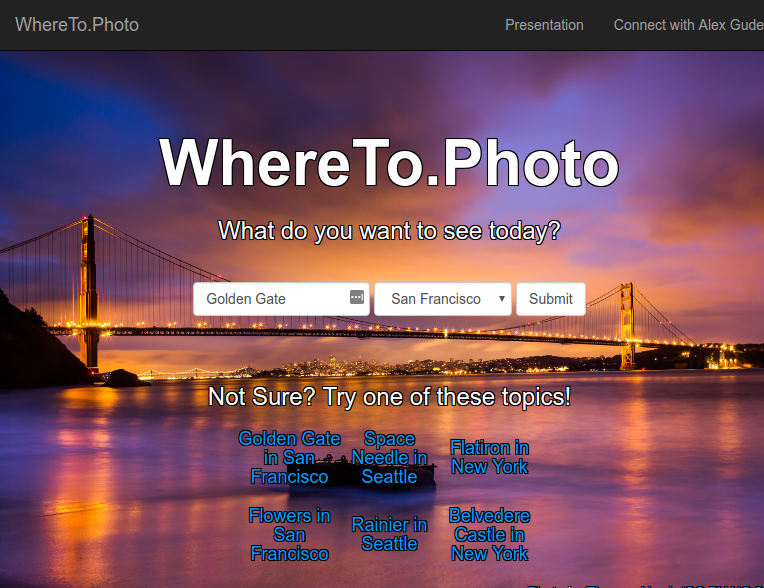 WhereTo.Photo: Using Data Science to Take Great Photos
Where is the best spot to take a photo in San Francisco? Learn how I answered this question with my Insight Data Science project! -
 Further Double-checking FiveThirtyEight’s 2016 Primary Predictions
Is FiveThirtyEight's Polls Plus model biased against any candidate? I continue my double-checking their model by looking at each candidate individually. -
 Double-checking FiveThirtyEight’s 2016 Primary Predictions
How well did FiveThirtyEight do in predicting the primary results? I Double-check FiveThirtyEight's Polls Plus model by comparing its predictions to the outcomes of the 2016 primaries.