Fate Dice: Statistics Testing Is Hard
View as Markdown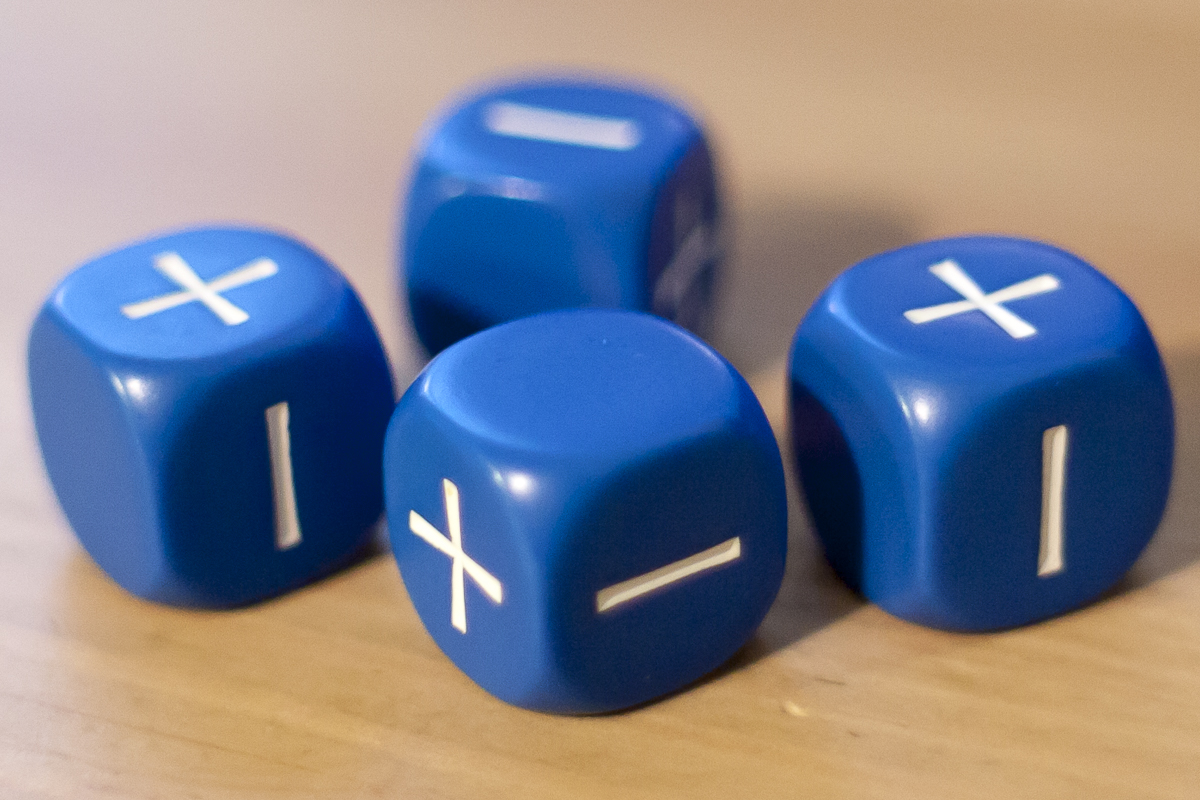
A few months ago I dug up the data from my Fate campaign and used it to test the dice we used for biases. I concluded that three of the sets were fine, but that the fourth set, the blue dice, were significantly biased, with p < 0.01!
As a scientist, I want to know more than simply whether or not the dice are biased; I also want to understand how they are biased. Is only one of the dice actually bad? Are they all slightly biased, but only when combined together is the bias significant? These questions could not be answered with the data at hand as only the final total for each roll was recorded. Fortunately, I still have the dice, so I decided to retest them!
That new test data is here. The old test data is here. You can find the Jupyter notebook used to make these calculations here (rendered on Github).
Individual Tests
To perform the test I rolled each 500 times in a row and recorded the results, for a total of 2000 rolls. See my previous post for a review of how Fate dice work.
One way to visualize all the rolls is to sum up the results for each die roll by roll. This gives a cumulative total that wanders up and down as the die rolls high and low results. Each die can then be modeled as a 1-dimensional random walk. I’ve plotted the contours that 95% and 99% of random walks lie within.

None of the dice wander too far out of the contours, but that doesn’t guarantee they are unbiased. For example, a die that always rolled 0 would be highly biased but also stay within the contours. It is still possible that together the dice are biased.
Group Test
Each die was rolled individually, but Fate dice are rolled four at a time and summed. In order to mimic this with the data I generated, I took the first roll of each of the four dice and added them together, treating that as one roll. I repeated this process for the rest of the data to get 500 rolls for the set of dice.
That gives the following distribution, where the points indicate the number of rolls of the dice that came up with a certain value, and the grey area is the range in which we would expect to find a result produced by a fair set of dice 99% of the time. I discussed in detail how these regions are computed in a previous post.

Let me stop for a second: This is surprising!
My previous test shows that the blue dice were biased at the p < 0.01 level and yet not a single count is outside the 99% range this time! Using a chi-squared test test on the new data gives p = 0.66, which does not rule out the unbiased hypothesis! In fact, this new test agrees the best with the unbiased hypothesis of all the tests performed last time!
We can compare the two tests using the same cumulative plot shown above, but this time taking the total of all four dice as a single step.

The first test, from my previous post, very quickly wanders outside the 99% contour and spends much of its time there. The second test stays solidly within the contours.
Explanation
So what explains a significant result in the first test and not in the second? There are a few possibilities, all of which fall into two categories: statistics and systematics.
Statistics
It is possible that the dice are biased (or fine) and the test that says otherwise is just a statistical fluke. At p < 0.01 that happens 1 in 100 times. Performing further tests would answer this question: biased dice would have more results with a low p-value, while unbiased dice would have few.
Systematics
It is also possible, and I think more likely, that one of the tests was performed in a biased manner. The second test was very carefully done, but the first test was less controlled: we wrote down results when we remembered, the person writing the results changed from day to day, and the person rolling also changed. Further, we often remembered to start recording only after a particularly bad roll. Performing multiple tests and looking at the distribution of the p value might offer a clue indicating whether the first test was systematically off, but it is hard to disentangle from statistical uncertainty.
Conclusion
So what was it, statistics or systematic? If I had to bet, I’d say that the first test was performed poorly and that the dice are probably fine. Am I going to test them again to check? Maybe… You will see it here if I do!