Topic: Cycling
View as MarkdownI love riding bikes, I love watching bike races, and I love using data to explore cycling. Here are the articles where I combine my love of cycling with my love of data and software:
-
 Plotting the 2022 Tour de France
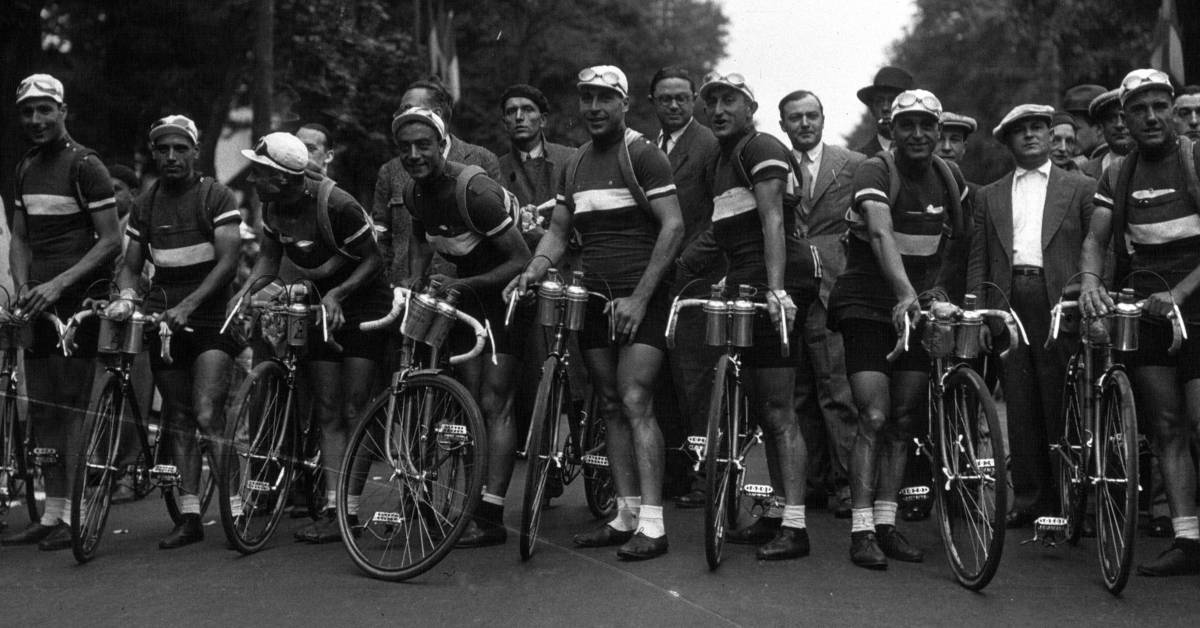
The 2022 Tour de France saw a new winner, Jonas Vingegaard! See how he won in this post! -
 Plotting the 2021 Tour de France
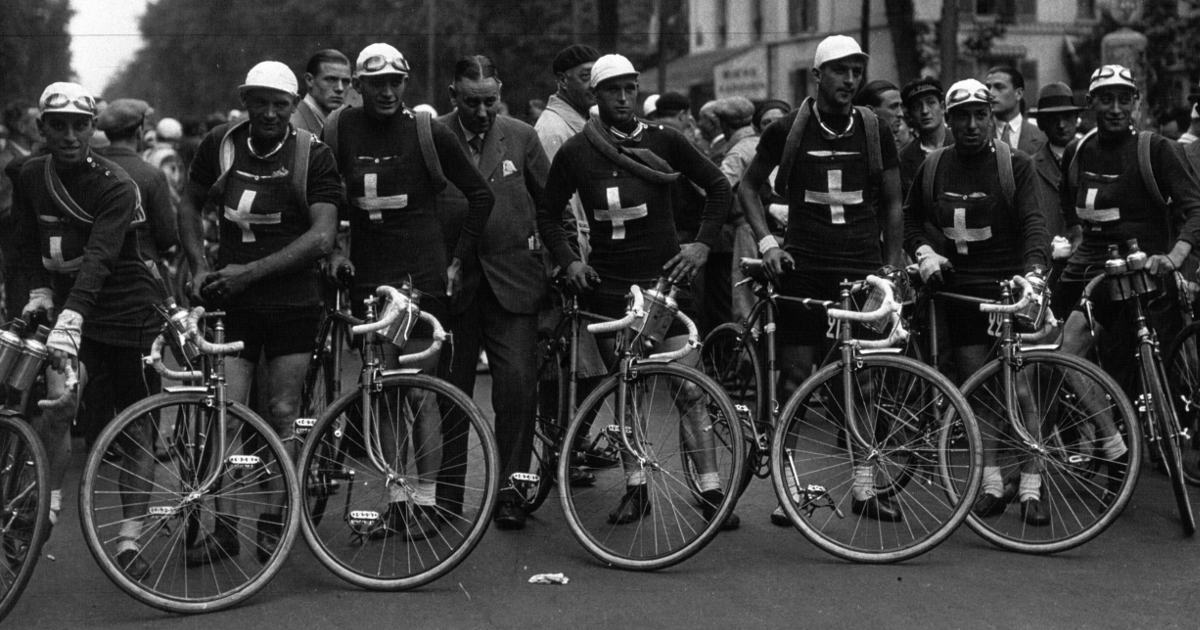
The 2021 Tour de France turned out much differently from last year's edition! See exactly how it unfolded in this post. -
 Plotting the 2020 Tour de France
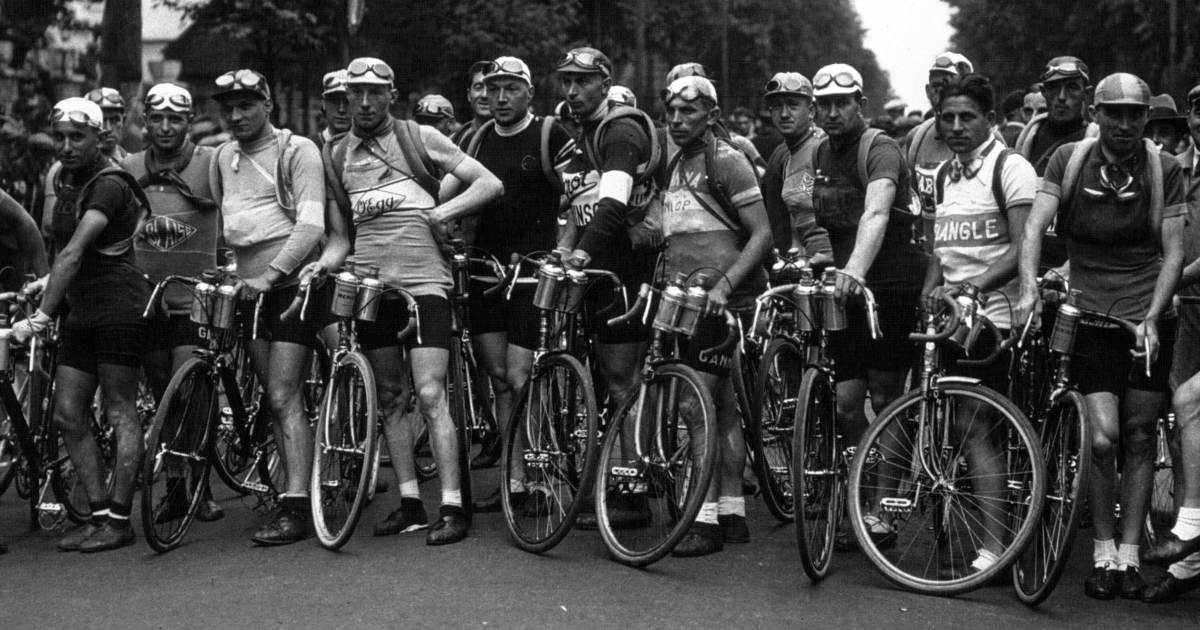
The Tour de France is a race decided by mere minutes; to see exactly how those minutes were earned, read on for my plots! -
 Improving Wikipedia’s Tour de France Prize Money Plot
Time to improve another plot from Wikipedia. This time I tackle one showing the prize money in the Tour de France over time! -
 Plotting the 2019 Tour de France
The Tour de France is a sporting event decided by mere minutes; to see exactly how those minutes were earned, read on for my plots! -
 Improving Wikipedia’s Hour Record Plot
I love Wikipedia, I love cycling, and I love data! So today, I improve Wikipedia's Hour Record Plot! Come take a look! -
 SWITRS: On What Days Do Cyclists Crash?
California crash data doesn't just cover cars, it covers bikes too! This time we look at when cyclists crash in California.