Introducing the SWITRS SQLite Hosted Dataset
View as Markdown
The State of California maintains a database of traffic collisions called the Statewide Integrated Traffic Records System (SWITRS). I have made extensive use of the data, including:
-
Finding out when automobiles, motorcycles, and bicycles crash.
-
Quantifying the dangers of daylight saving time and the end of daylight saving time.
I even maintain a helpful script to convert the messy CSV files California will let you download into a clean SQLite database.
But requesting the data is painful; you have to set up an account with the state, submit your request via a rough web-form, and wait for them to compile it. Worse, in the last few years California has limited the data to 2008 and later!
Luckily I have saved all the data I’ve requested which goes back to January 1st, 2001. So I resolved to make the data easily available to everyone.
The SWITRS Hosted Dataset
I have combined all of my data requests into one SQLite database. You no longer have to worry about requesting the data or using my script to clean it up since I have done all that work for you.
You can download the database from either Kaggle (requires account) or Zenodo (no account required!) and get right to work! I have even included a demo notebook on Kaggle so you can jump right in!
The dataset also has its own DOI: 10.34740/kaggle/dsv/1671261
Read on for an example of how to use the dataset and an explanation of how I created it.
Data Merging
I have saved four copies of the data, requested in 2016, 2017, 2018, and 2020. The first three copies have data from 2001 until their request date, while the 2020 dataset only covers 2008–2020 due to the new limit California instituted. To create the hosted dataset I had to merge these four datasets. There were two main challenges:
-
Each dataset contains three tables: collision records, party records, and victim records; but only the collision records table contains a primary key. That key is the
case_id. -
The records are occasionally updated after the fact, but again only the collision records table has a column (
process_date) indicating when the record was last modified.
I made the following assumptions when merging the datasets:
-
The collision records table from the more recent dataset was correct when there was a conflict.
-
The party records and victim records corresponding to that collision record were also the most correct.
These assumptions allowed me to write out the following join logic to create the hosted set. First I selected case_id from each copy of the data, preferring the newer ones:
-- Select all from 2020
CREATE TABLE outputdb.case_ids AS
SELECT case_id, '2020' AS db_year
FROM db20.collision;

-- Now add the rows that don't match from earlier databases, in
-- reverse chronological order so that the newer rows are not
-- overwritten.
INSERT INTO outputdb.case_ids
SELECT * FROM (
    SELECT older.case_id, '2018'
    FROM db18.collision AS older
    LEFT JOIN outputdb.case_ids AS prime
    ON prime.case_id = older.case_id
    WHERE prime.case_id IS NULL
);

-- and the same for 2017 and 2016
Then I selected the rows from the collision records, part records, and victim records that matched for each year:
CREATE TABLE outputdb.collision AS
SELECT *
FROM db20.collision;

INSERT INTO outputdb.collision
SELECT * FROM (
    SELECT col.*
    FROM db18.collision AS col
    INNER JOIN outputdb.case_ids AS ids
    ON ids.case_id = col.case_id
    WHERE ids.db_year = '2018'
);

-- and similarly for 2017 and 2016, and
-- for party records and victim records
The script to do this is here.
Using the dataset
Using the hosted dataset, it is simple to reproduce the work I did when I announced the data converter script: plotting the location of all crashes in California.
Just download the data, unzip it, and run the notebook (rendered on Github). This will produce the following plot:
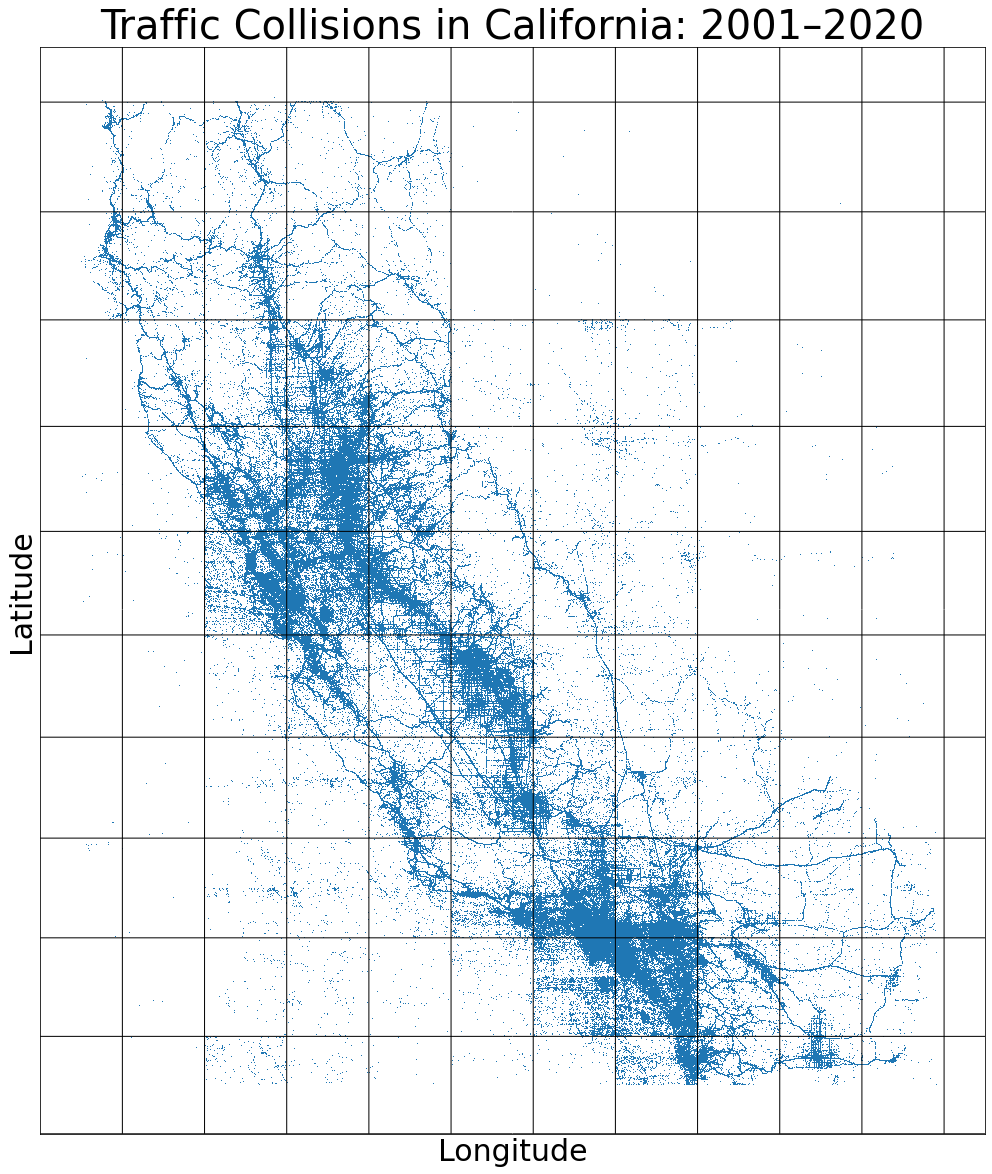
I hope this hosted dataset makes working with the data fast and easy. If you make something, I’d love to see it! Send it to me on BlueSky: @alexgude.com