Matching Cars with Siamese Networks
View as MarkdownThis article originally appeared on Lab41's blog: Gab41. It is reposted here with permission.
Lab41 just finished Pelops, a vehicle re-identification project using data from fixed video cameras. Last time I talked about “chipping”, that is extracting an image of a vehicle from a frame of video automatically. We found that background subtraction worked OK based on the small amount of labeled data we had.
In this post I’ll go over the rest of the pipeline: feature extraction and vehicle matching.
Feature Extraction
Machine learning algorithms operate on a vector of numbers. An image can be thought of as a vector of numbers—three numbers to define the color of each pixel—but it turns out that taking these numbers and transforming them gives a more useful representation. This step of taking an image and creating a vector of useful numbers is called feature extraction. We performed feature extraction using several different algorithms.
Our first method of feature extraction was an old one: Histogram of Oriented Gradients or HOG. HOG was first proposed in the 80s, but has since found uses in identifying pedestrians and was used by our sister lab CosmiQ Works to identify boat headings. HOG effectively counts the number and direction of edges it finds in an image, and as such is useful for finding specific objects. HOG lacks color information, so in addition to the output from HOG, we appended a histogram of each color channel.
Our second method of feature extraction was based on deep learning. We took ResNet501 trained on ImageNet,2 removed the fully connected layers, and treated the 2048-dimension output of the convolutional layers as our feature vector. It is well known that networks trained on ImageNet, despite being exceptionally good at identifying dogs and cats, are also very good for general image problems. It turns out the edges, shapes, and colors learned for dogs are also, in different configurations, useful for cars. For more details on the ResNet architecture, see my reading group blog post.
Our third method of feature extraction was a fine-tuned ResNet50. Pretrained networks are good at general image tasks, but they can be “fine-tuned” to perform better on specific tasks. For Pelops that specific task was make, model, and color identification of cars in a labeled dataset. It is hoped that making the model better at make, model, and color detection will generate features that are more useful for matching cars. This makes intuitive sense: any human matching cars would use make, model, and color as primary features.
Matching
Once all of the vehicles have feature vectors associated with them, those vectors can be used to match vehicles to each other. There are a few ways to do this, starting with the simplest, which is to calculate a distance between the vectors. This works great if the feature extractors are designed to make the distance meaningful, but this is not generally the case. Neural networks can have cost functions based on distance, but ResNet50 does not. So this method, while attractive in simplicity, is not a good solution.
The second possible way of matching is to train a traditional (that is, non-deep learning based) classifier. We trained a logistic regression model, a random forest, and a support vector machine on top of each of the types of feature vectors. Each model was given two feature vectors and asked to classify them as coming from the same vehicle, or not. The training data was balanced so that there were as many positive as negative examples. The best accuracy these models achieved was 80%, although most struggled to pass 70%. Accuracy is the number of true results divided by the number of total items tested.
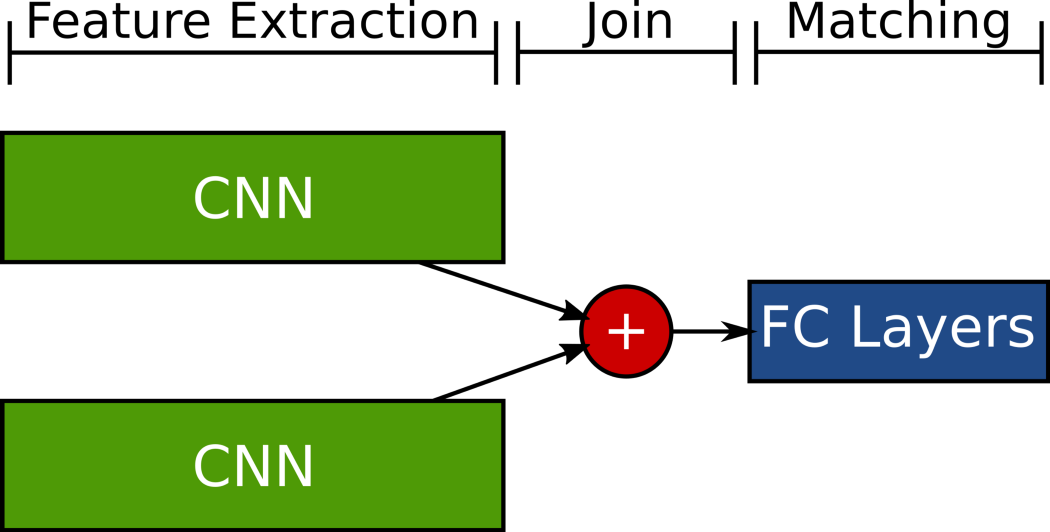
The third method of matching was to use a neural network as a classifier. Once we added a deep learning classifier on top of our deep learning feature extractor, we had a Siamese neural network. For details about how we trained such a network, and for an overview of its architecture, see our blog post here. The Siamese network performs the feature extraction and matching in one step, and so allows optimizing both portions at the same time. This arrangement achieved the best results by far, hitting nearly 93% accuracy on our test set.
Results
Dataset
In order to determine how well our various feature extraction and matching algorithms did, we needed a labeled dataset. We used the VeRi dataset,3 which contains pictures of 776 uniquely identified vehicles. There are multiple pictures of each vehicle taken from 20 different traffic cameras in China. An example of two VeRi images from Liu et al.4 is shown below.
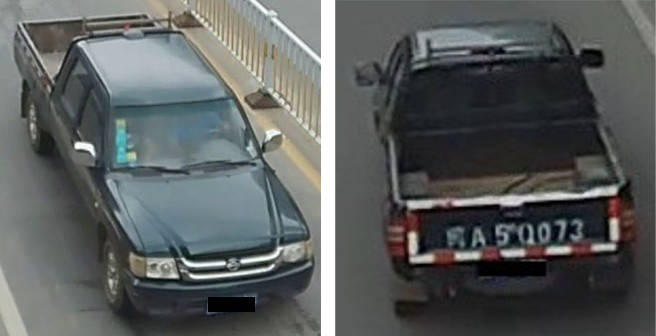
This dataset allowed us to test our performance on essentially the exact task we were hoping to solve: re-identifying the same vehicle if it passed another camera.
Metric
The final metric we used is a cumulative matching curve (CMC). A CMC is constructed as follows: 10 vehicles are selected in one set, and 10 in another. These two sets have one car in common that is the correct match. The algorithms then rank all 100 pairwise comparisons by confidence that they are the same vehicles. The rank of the correct pair on this list of 100 pairs is recorded. This trial is repeated for many randomly selected sets. The curve is generated by recording what fraction of trials have the correct pair ranked at a certain position or better.
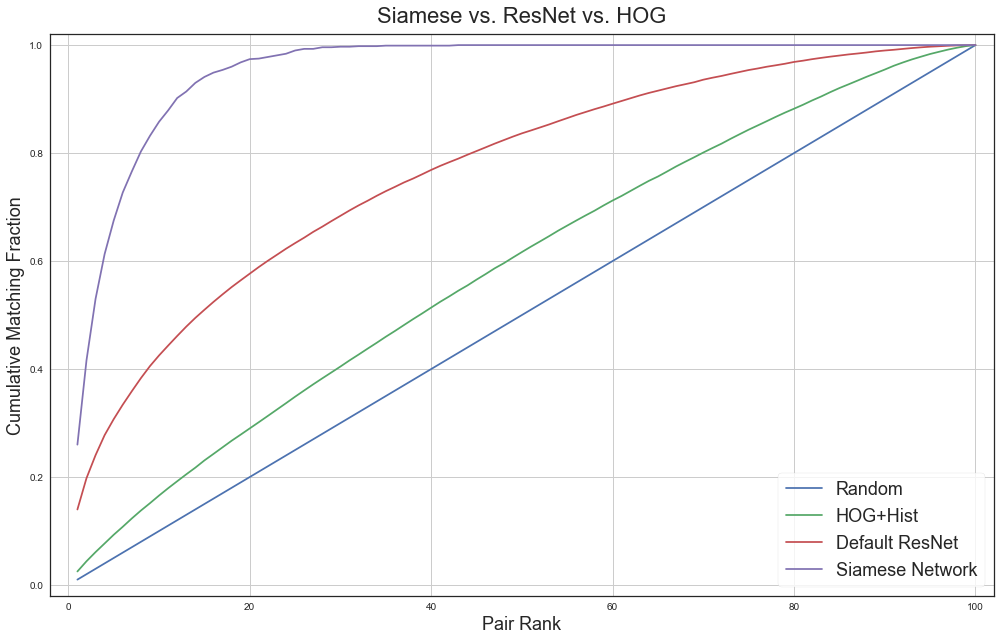
The CMC plot shows the final Siamese network compared to HOG + Color Histogram using euclidean distance, ResNet50 with euclidean distance, and a purely random selection of matches. The sharp rise in the Siamese CMC is because it is very good at matching on color, so all matches where the cars share the same color appear near the top of the rankings. The slow rise after about rank 10 is due to cases where color was not very helpful in making the match, either because the car was a very common color, or because it was a color easily mistaken for another (for example, yellow and white are hard for the network to tell apart).
-
He, Kaiming and Zhang, Xiangyu and Ren, Shaoqing and Sun, Jian. “Deep Residual Learning for Image Recognition” 2016 IEEE Conference on Computer Vision and Pattern Recognition (CVPR). 2016. pp. 770–778. doi: 10.1109/CVPR.2016.90. ↩
-
Deng, J. and Dong, W. and Socher, R. and Li, L.-J. and Li, K. and Fei-Fei, L. “ImageNet: A Large-Scale Hierarchical Image Database” CVPR09. 2009. ↩
-
Liu, Xinchen and Liu, Wu and Ma, Huadong and Fu, Huiyuan. “Large-scale vehicle re-identification in urban surveillance videos” 2016 IEEE International Conference on Multimedia and Expo (ICME). 2016. pp. 1–6. doi: 10.1109/ICME.2016.7553002. ↩
-
Liu, Xinchen and Liu, Wu and Mei, Tao and Ma, Huadong. “A Deep Learning-Based Approach to Progressive Vehicle Re-identification for Urban Surveillance” European Conference on Computer Vision. Edited by Leibe, Bastian and Matas, Jiri and Sebe, Nicu and Welling, Max. Springer International Publishing. 2016. pp. 869–884. doi: 10.1007/978-3-319-46475-6_53. ↩