Introducing 'SWITRS to SQLite'

The State of California maintains a database called the Statewide Integrated Traffic Records System (SWITRS). It contains a record of every traffic collision that has been reported in the state—the time of the crash, the location, the vehicles involved, and the reason for the crash. Even better, it is publicly available!
Unfortunately, the data is delivered as a set of large CSV files. Normally you could just load them into Pandas, but there is one, big problem: the data is spread across three files! This means you must join the rows between them to select the incidents you are looking for. Pandas can do these joins, but not without overflowing the memory on my laptop. If only the data were in a proper database!
SWITRS-to-SQLite
To solve this problem, I wrote SWITRS-to-SQLite. SWITRS-to-SQLite is a Python script that takes the three CSV files returned by SWITRS and converts them into a SQLite3 database. This allows you to perform standard SQL queries on the data before pulling it into an analysis system like Pandas. Additionally, the script does some data cleanup like converting the various null value indicators to a true NULL, and converting the date and time information to a form recognized by SQLite.
Installation and Running
Installation is easy with pip:
pip install switrs-to-sqlite
Running the script on the downloaded data is simple:
switrs_to_sqlite \
CollisionRecords.txt \
PartyRecords.txt \
VictimRecords.txt
This will run for a while (about an hour on my ancient desktop) and produce a SQLite3 file named switrs.sqlite3.
Crash Mapping Example
Now that we have the SQLite file, let us make a map of all recorded crashes. We load the file and select all incidents with GPS coordinates as follows:
import pandas as pd
import sqlite3

# Read sqlite query results into a pandas DataFrame
with sqlite3.connect("./switrs.sqlite3") as con:

    query = (
        "SELECT Latitude, Longitude "
        "FROM Collision AS C "
        "WHERE Latitude IS NOT NULL AND Longitude IS NOT NULL"
    )

    # Construct a Dataframe from the results
    df = pd.read_sql_query(query, con)
Then making a map is simple:
from mpl_toolkits.basemap import Basemap
import matplotlib.pyplot as plt

fig = plt.figure(figsize=(20,20))

basemap = Basemap(
    projection='gall',
    llcrnrlon = -126,   # lower-left corner longitude
    llcrnrlat = 32,     # lower-left corner latitude
    urcrnrlon = -113,   # upper-right corner longitude
    urcrnrlat = 43,     # upper-right corner latitude
)

x, y = basemap(df['Longitude'].values, df['Latitude'].values)

basemap.plot(x, y, 'k.', markersize=1.5)
This gives us a map of the locations of all the crashes in the state of California from 2001 to 2016:
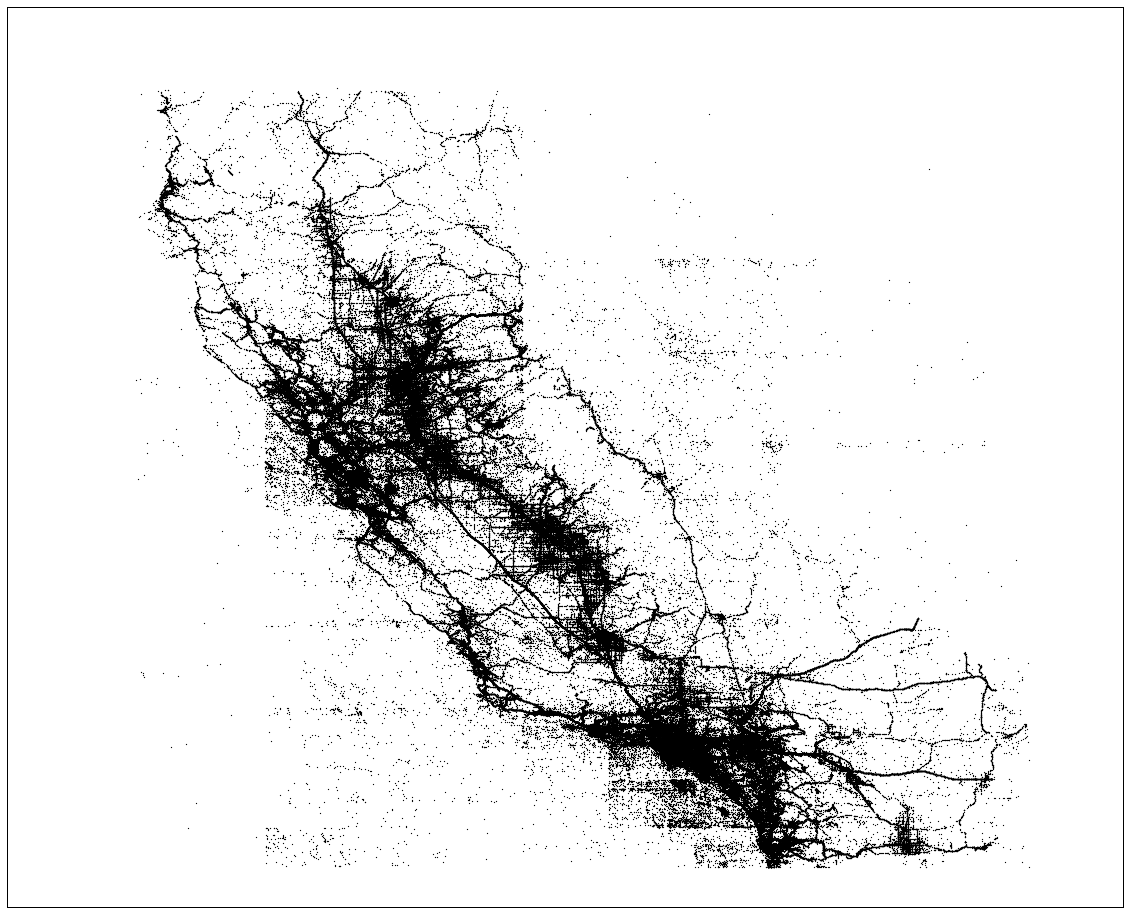
There are some weird artifacts and grid patterns that show up which are not due to our mapping but are inherent in the data. Some further clean up will be necessary before doing any analysis! A Jupyter notebook used to make the map can be found here (rendered on Github).