My PhD Thesis, In Short
Three years ago today, I defended my thesis and graduated from the University of Minnesota with a PhD in high energy particle physics. As part of that endeavor, I spent years traveling to and from CERN where I studied the decay of Z bosons into electrons. I wrote an esoteric thesis on a very specific part of this decay which I have, because no one is ever going to read it, attempted to summarize below in a more accessible fashion.
Measurement of the phistar distribution of Z bosons decaying to electron pairs with the CMS experiment at a center-of-mass energy of 8 TeV
The Standard Model of particle physics is one of the most accurate theories humans have ever come up with, describing nature almost exactly as we observe it. Yet, for all its accuracy, we know it is still incomplete, and even in the more complete areas there are regions where it is very difficult to calculate what will happen. One of these regions is low energy quantum chromodynamics (QCD). This is the part of the theory that handles the interaction of protons, neutrons, the quarks that make them up, and the gluons that bind them together.
For my thesis, I studied the interaction \(pp \to Z \to e^-e^+\), that is, two protons colliding to produce a Z boson which then decays to two electrons.1 This lets us explore the low energy QCD region (the \(pp\) collision) using particles (the \(e^-e^+\) pair) which do not have any messy QCD interactions to confound the data. More specifically, I looked at the transverse momentum, \(Q_T\), of the Z boson, or how much the boson was moving in the direction transverse to the proton beams at the time it decayed.
The Large Hadron Collider and the Compact Muon Solenoid
The Large Hadron Collider (LHC) is a very large, and very high energy, particle collider on the boarder between Switzerland and France. It takes protons and accelerates them along a circular track until they are traveling close to the speed of light, and then smashes them together. This creates a region of space with a lot of energy which is dissipated by creating new particles.
Looking at these collisions allows us to test the Standard Model at very high energies where undiscovered particles may exist. Multiple smaller particle accelerators feed into the LHC (as shown below) and act like on-ramps, getting the particles up-to-speed before they enter the LHC. The LHC hosts four major experiments: ATLAS; ALICE; LHCb; and CMS, the Compact Muon Solenoid, which was my experiment.

CMS is a 14,000 ton experiment run by nearly 3000 physicists and engineers. It is built around a point on the LHC where protons collide and measures the speed, mass, and flight direction of all the particles that are created after the two protons collide. Some people like to think of it as a very large camera, and that actually isn’t so bad an analogy: like a camera, CMS measures particles using silicon (and some other materials) and saves the output somewhere to be viewed later.
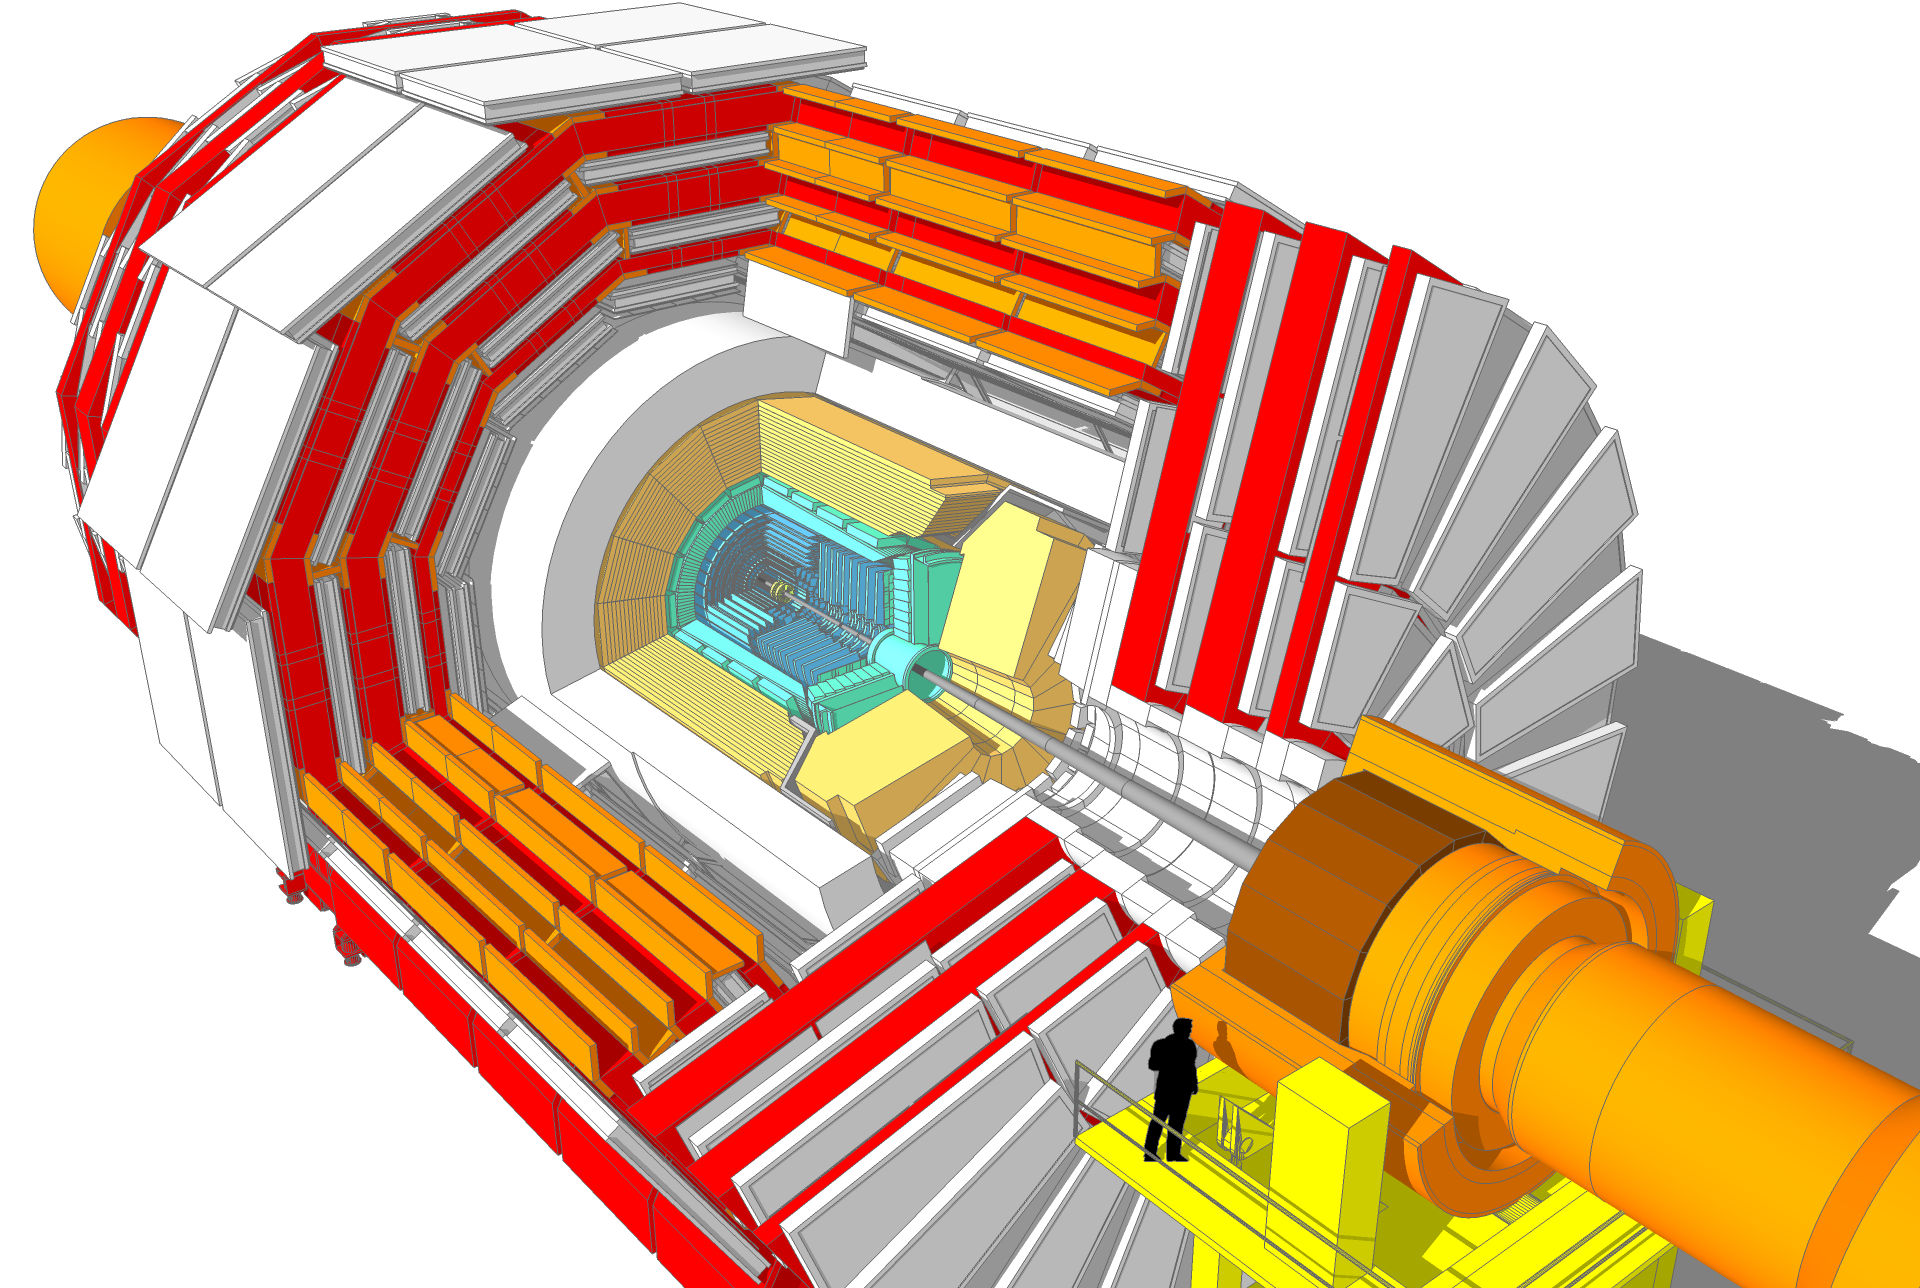
The cutaway above shows the detector (with silhouette for scale).2 The collision point is in the center. The detector is built in layers around this collision point, with each layer designed to measure a different property of a particle. By combining the measurements from all the layers we can tell which particles were created and what direction they traveled in.
Doing research with the data generated by CMS has some subtleties, but it is essentially just counting. We predict how many events with a certain characteristic, for example containing two high energy electrons, we should see based on our understanding of the Standard Model. Then we count the number of events that CMS recorded with those characteristics and compare the data to our prediction.
Transverse Momentum
I said I studied low energy QCD, but then immediately introduced the highest energy collider in the world. This is not, as it turns out, a contradiction. While the LHC is very high energy, all that energy is directed along the beamline; the protons have almost no energy transverse to the beamline,3 and so this gives us the low energy QCD system that we desire. The \(Z \to ee\) decay is a great way to study this low energy regime because neither the Z nor the electrons interact via QCD, so the only QCD effects in the decay chain are from the initial proton-proton collision. This makes it an easy to measure signal.
I measured the transverse momentum, \(Q_T\), of the Z boson, which describes the way the boson moves just before it decays. Measuring this not only tells us about the low energy regime of QCD, but it also helps to constrain the mass of the W boson, which is otherwise hard to measure. The W mass is interesting because it helps determine some fundamental quantities in the Standard Model, and because there is some disagreement between the measured value and the predicted value.
But actually, I didn’t measure \(Q_T\), I measured a new variable called \(\phi^{*}\), which measures the same effect as \(Q_T\), but is more robust against shortcomings in the detector design. \(\phi^{*}\) measures the angle between the two electrons instead of their energy, which is easier to measure accurately due to the design of CMS.
Backgrounds, Event Selection, and Other Issues
The events I was interested in had two electrons in them, but not every event with two electrons comes from a Z decay. Events that produce two electrons for other reasons are called background events, and the primary difficulty in any high energy experiment is separating the background from the events we are interested in, called signal events. We use simple selection rules, called cuts, to select the events we want. This selection happens in two stages:
- As the collisions are happening in the detector (at a rate of 40 million times a second), a fast data processing system called the trigger applies very simple cuts to select interesting events out of the huge number of uninteresting ones.
- After the data has been saved to disk, I apply a more precise set of cuts to select just the events that I think are likely to come from the \(Z \to ee\) decay.
For example, in that second set of cuts I required two electrons, one with very high energy and in the middle of the detector (where we get the most accurate measurement), and one other with a little less energy anywhere in the detector. Even with this selection some background events slip through; figuring out how many is most of the work done in my thesis, because when we count up events, we naturally do not want to include the background.
The way we try to figure out what the background looks like is through Monte Carlo experiments (MC) where we generate virtual data using the math prescribed by the Standard Model. We tune this generated data on other particle decays that look similar to, but are not, the ones we are interested in. For example, since I cared about double electron events, we tuned our MC on events with one electron and one muon (which is very much like an electron, but heavier).
Below is an example of what the MC predicted the signal (blue) and backgrounds (everything else) would look like for my experiment. The black points are all the events selected for the analysis, so you can see the agreement is not perfect.

There were other issues to work through as well, like estimating how good CMS was at measuring various things. These biases were mostly corrected or estimated by using MC events and putting them through the analysis pipeline. This lets us check what the analysis would have measured, while having information about the true underlying event.
Results
The results of six years of my life are shown in the (absolutely hideous, I confess) plot below:

Each collection of points in the top plot is a count of the events, for a specific bin in \(\phi^*\). The black points are the count of events seen in CMS, and the colored points are the number of events predicted by various Monte Carlo generator programs that use different approximations of the Standard Model. The bottom plot is the ratio of MC events over observed events. If the generators were perfectly simulating reality, all the points would be right at 1, but of course they are not perfect so the points drift up and down. The blue points (from the MadGraph) do the best job, but even they miss by up to 5%.
In Summary
So that’s it! I measured the angle between pairs of electrons in the CMS detector, and compared it to the angle predicted by the Standard Model. The result can be used to fine-tune the Monte Carlo generators we use so that future measurements have better estimates. But will my result be used for that? It’s unclear.
I graduated quickly without publishing the results of my thesis in a journal. In fact, my thesis was embargoed for six months to let my adviser and post doc tidy it up for publication, but various complications ultimately prevented that from happening.
That is the reality of scientific research though: spending years of your life chasing down a subject cared about by only a handful of people. That is part of the reason I wanted to write this post, in the hope that more than a handful of people would read it, and learn about what I did.
-
Well, an electron and a positron, but particle physicists just call those electrons because precision is for mathematicians. ↩
-
Sakuma, T. and McCauley, T., Detector and Event Visualization with SketchUp at the CMS Experiment, Journal of Physics: Conference Series, Volume 513, Track 2 (2014), doi: 10.1088/1742-6596/513/2/022032. Image avaliable under CC-BY 3.0. ↩
-
Space has three dimensions. The beam moves in one of those dimensions; the other two dimensions are the ones transverse to the beam line. ↩