Caltrain Visual Schedule
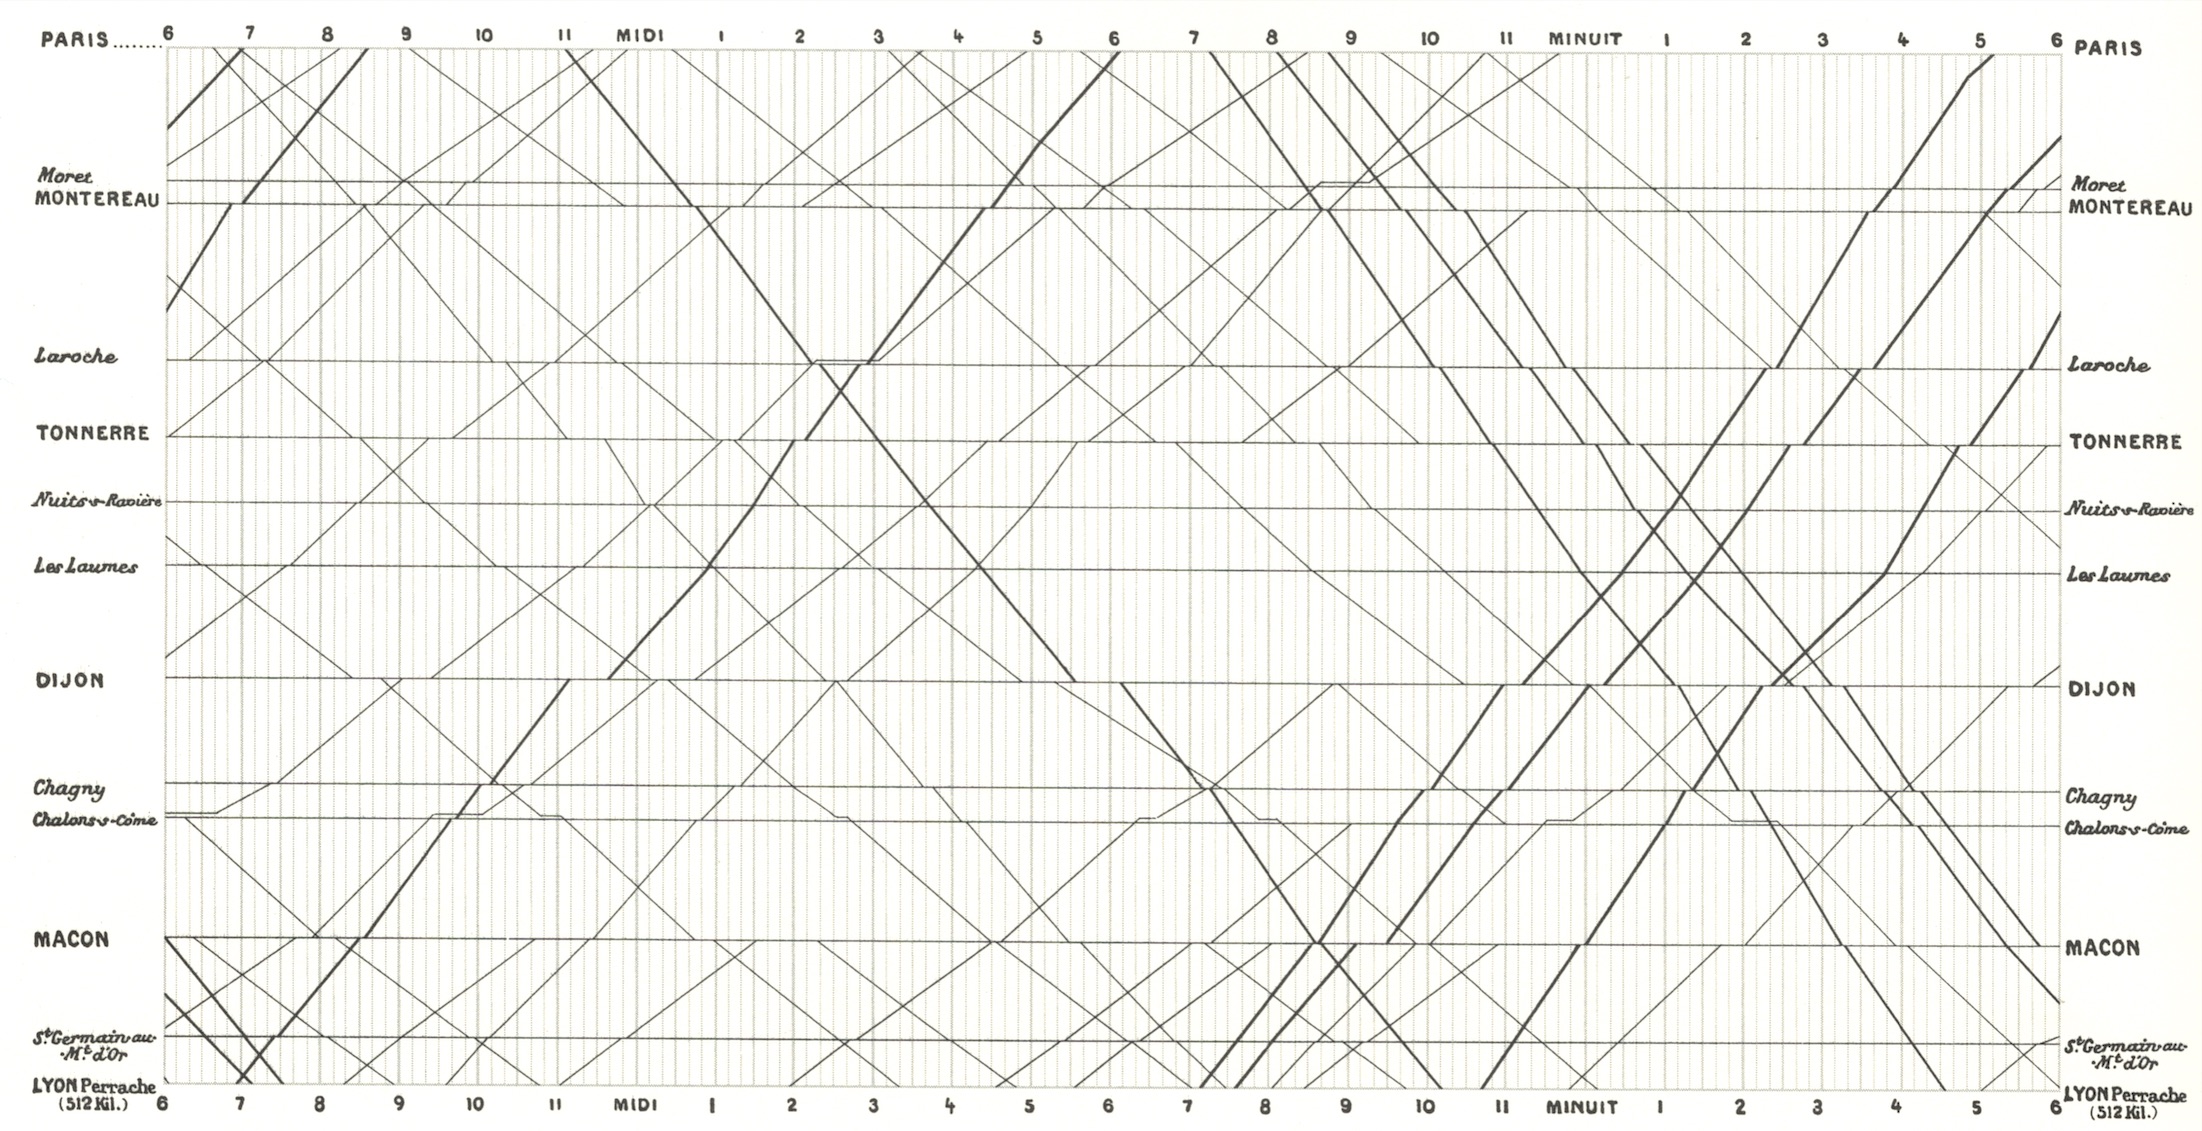
In 1878, Étienne-Jules Marey published La Méthode Graphique,1 a manual on using graphs for data analysis. The book included Ibry’s2 famous visualization of a French train schedule which shows the position (y-axis) of trains traveling from Paris to Lyon as a function of the time of day (x-axis). The schedule elegantly packs a lot of information into a small space: the speed and direction of trains are indicated by their slope, and when lines cross it indicates that the trains pass each other. The schedule is such an iconic visualization that Tufte used it as the cover of The Visual Display of Quantitative Information.
While Ibry’s schedule is the most famous example, it was not the first: an earlier example was produced by Serjev in Russia. Nor was it the last, as many people have produced similar diagrams for the T in Boston, BART, and Caltrain (and over, and over, and over again). As a frequent Caltrain commuter, I thought I would try to put my spin on it. You can find the Jupyter notebook used to make these schedules here (rendered on Github). The schedule data is from Caltrain’s developer site.
Caltrain
The three types of train are color coded as follows: local trains are blue, limited-stop trains are green, and baby bullets are red. Every stop for a train is indicated by a circle. The spacing between the stations on the y-axis is scaled to the actual distance recorded on the track mileposts.3 Click the schedules for larger versions.
Weekday
On the weekday there are so many trains that the full schedule is hard to read, so instead I have focused on the morning and evening commute times. The full weekday schedule is here (northbound only and southbound only). The full schedule with Gilroy included is here.


In the morning there are six northbound bullets and five southbound while in the evening the numbers are reversed. There are pairs of limited trains where one of the pair makes most southern stops, and the other makes most northern stops; the train making fewer stops initially catches up but then falls back again as the lead train starts making fewer stops. We can see that the bullets overtake the limited and local trains near Bayshore and Lawrence. Finally, it is tough to see because I have cut off stations after Tamien, but three trains head north from Gilroy early in the morning, and three trains end there in the evening, ready for the next morning’s commute.
Weekend


The weekends have far fewer trains. A local train runs in each direction hourly, and there are four bullets each day. Only one bullet is running at a time, and so it is possible they use the same rolling stock for the north and southbound trips. Saturday has two more north bound, and one more southbound train than Sunday.
-
The full title is La Méthode Graphique Dans les Sciences Expérimentales et Principalement en Physiologie et en Médecine, or roughly The Graphical Method in Experimental Sciences and Mainly in Physiology and Medicine. ↩
-
The caption in Marey’s book reads: “Graphique de la marche des trains sur un chemin de fer, d’après la méthode de Ibry” or “Graph showing the progress of trains on a railway, according to the method of Ibry”. Unfortunately, little else is know of Ibry, and so this type of chart is often named for Marey instead. ↩
-
The mileposts markers are off by up to 100m for stations south of Lawrence. I tried to measure the actual track distances using OpenStreetMap but found that I could not do so more accurately than the milepost numbers. ↩